

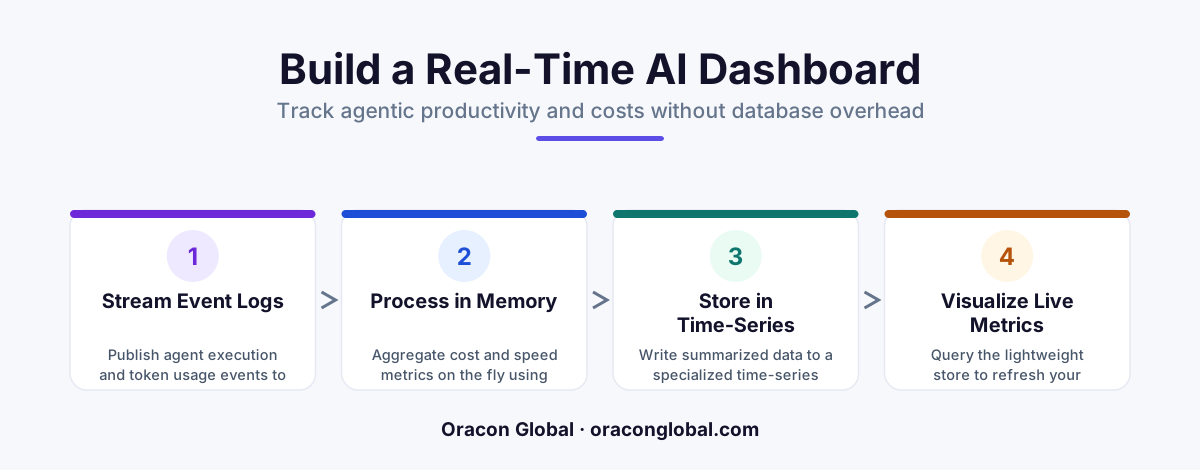
To monitor AI digital employees without slowing down your production database, bypass traditional transactional tables for operational telemetry. By routing live agent execution logs through an event stream to a time-series cache, you can track real-time agentic productivity and resource cost metrics with zero database overhead.
When you deploy AI digital employees to handle complex workflows like customer support, invoice reconciliation, or logistics routing, you are no longer managing simple software scripts. You are managing an active digital workforce. To ensure these autonomous agents operate efficiently, operators must track their performance as closely as they would track human team members.
However, traditional monitoring methods quickly break down under the weight of agentic operations. A single task executed by an autonomous agent might involve dozens of loop steps, multiple vector search queries, tool calls, and thousands of raw tokens. If your system writes every single step, latency metric, and token count directly to your primary transactional database, you will quickly degrade system performance and inflate your cloud hosting bills.
To scale your AI workforce sustainably, you need a dedicated performance dashboard for AI digital employees. This guide explains how to build a lightweight, real-time telemetry pipeline to track agentic productivity and monitor critical resource cost metrics without introducing database overhead or slowing down your core business operations.
The Architectural Challenge: Why AI Telemetry Crushes Traditional Databases
Standard web applications are quiet. A user loads a page, the database runs a quick read query, and the page renders. Even when a user updates a profile or submits an order, it results in a single, predictable write operation to your transactional database.
AI digital employees are incredibly chatty by comparison. When an agent processes a customer inquiry, it does not just run one query. It reads the incoming message, queries a vector database for context, evaluates the retrieved data, calls an internal API tool, reads the tool response, reflects on its progress, and then formulates a final output.
If you attempt to write the logs, prompt tokens, completion tokens, execution latencies, and status updates of every sub-step directly into your primary PostgreSQL or MySQL database, you face immediate bottlenecks:
- Write Saturation: High-frequency write locks block critical business transactions like customer checkouts or order creation.
- Storage Inflation: Storage tables swell with millions of rows of ephemeral step-by-step logs that are only valuable for real-time monitoring, not long-term storage.
- Performance Lag: The actual execution speed of the AI agent slows down because it must wait for the database write confirmation before proceeding to its next step.
To avoid this database overhead, you must separate your application's transactional state from your agentic operational telemetry.
The Architecture of an Overhead-Free Real-Time Dashboard
To track performance in real time without affecting your application database, you must decouple the metric collection process. A modern, lightweight architecture relies on three distinct layers: an asynchronous event publisher, an in-memory time-series cache, and a lightweight visualization frontend.
1. The Asynchronous Event Publisher
As your AI digital employee executes its workflow steps, it should never write directly to a persistent storage system. Instead, the agent emits lightweight, structured JSON events to an in-memory queue or stream. This is a non-blocking "fire-and-forget" write that takes less than a millisecond, allowing the AI agent to continue executing its task without waiting on database write confirmations.
2. The Time-Series Cache Layer
An in-memory, key-value store optimized for high-write throughput captures the incoming event stream. This layer aggregates raw telemetry data, incrementing token counts, logging execution times, and tracking success states on the fly. By keeping this live metrics data in memory, you protect your hard-disk-backed relational database from thousands of unnecessary write queries.
3. The Lightweight Dashboard Interface
The administrative dashboard queries the in-memory cache directly to render live charts, progress bars, and cost calculations. Because the cache reads are incredibly fast and completely isolated from your primary database tables, business operators can refresh, filter, and monitor the dashboard in real time with zero risk of slowing down production workflows.
Key Metrics Your Dashboard Must Track
An effective performance dashboard for AI digital employees must translate technical execution logs into clear, actionable business metrics. To understand the true ROI of your digital workforce, your dashboard should organize data into three distinct categories.
Agentic Productivity
This category measures how effectively your agents are completing their assigned tasks. Key indicators include:
- Task Completion Rate: The percentage of initiated workflows that successfully reached an approved end-state without human intervention or execution errors.
- Average Steps per Task: The number of internal reasoning loops or tool calls an agent takes to resolve a query. A sudden rise in steps can signal logic looping or poorly defined prompt instructions.
- First-Response Latency: The time elapsed between a user submit trigger and the agent's first meaningful action or response.
Resource Cost Metrics
Operating frontier LLMs and vector search systems incurs direct utility costs. To prevent budget surprises, you must monitor your consumption metrics in real time:
- Token Consumption (Input vs. Output): Real-time tracking of input tokens (context, system instructions, dynamic data) and output tokens (generation). This is the foundation of your live cost calculations.
- Direct API Cost per Task: A real-time dollar calculation mapped to the specific LLM model pricing structures, showing operators exactly how much money each run costs.
- Context Cache Efficiency: The percentage of input tokens that successfully leverage prompt caching models to reduce overall API bills.
Operational Health
These technical metrics help your engineering team identify infrastructure bottlenecks before they impact your end users:
- Tool Call Latency: How long external databases or third-party APIs take to return data to your AI agent.
- Error and Retry Rates: The frequency of rate-limit blocks (HTTP 429 errors) or failed API payloads that forced the agent to halt or retry its workflow.
Implementing Automatic Data Retention Policies
Real-time telemetry data is highly valuable during the moment of execution and for immediate daily review. However, keeping second-by-second step logs forever is unnecessary and expensive. To maintain a lightweight dashboard footprint, you must build automated retention policies into your architecture.
Your monitoring system should automatically expire detailed, low-level execution logs after a short window—typically 7 to 14 days. This is ample time for your operations team to audit agent behavior, investigate edge-case failures, or verify execution steps.
Before these detailed logs are permanently purged from the high-speed cache, a lightweight cron utility aggregates the data into high-level, daily operational summaries. These summaries—such as total tasks completed, daily token spend, and average daily latency—are lightweight and can be safely written to your long-term database to provide historical tracking for monthly and quarterly business reviews.
Optimize LLM API Costs with Transparent Insights
When you build a dedicated performance dashboard, you gain complete transparency over your digital employees' operational patterns. Instead of guessing why your monthly API bills fluctuate, you can pinpoint the exact workflows, users, or system prompts driving your expenses.
For instance, if your dashboard reveals that a specific customer support agent consumes a high volume of input tokens but yields low task-completion rates, your team can instantly target the root cause. You can optimize the agent's background context window, prune bloated database files, or implement static business rules to bypass expensive LLM calls altogether. With a custom dashboard, you have the raw data required to continuously tune and optimize your AI digital workforce for maximum efficiency and minimum cost.
Let's Build Your Custom AI Dashboard
Building high-performing, production-ready AI agents requires more than just smart prompts. It requires robust, enterprise-grade architecture that protects your core business databases while giving you absolute visibility into operational costs and performance.
At Oracon Global, our senior in-house development team builds robust, full-stack AI solutions, custom web and mobile apps, and enterprise integrations tailored specifically to your unique business operations. Our clients own 100% of their code and intellectual property, ensuring your telemetry and proprietary data remain entirely yours. To see how we build high-efficiency AI digital employees and real-time monitoring tools for businesses worldwide, explore the live AI demos on our website.
Ready to deploy a manageable, highly productive AI workforce for your business? Contact the team at Oracon Global today to discuss your project requirements.
Frequently asked questions
Why shouldn't I store real-time AI agent logs in my primary application database?
AI digital employees execute hundreds of intermediate steps, prompt evaluations, and API calls for a single task. Writing every single token count, latency metric, and step status to a traditional transactional database like PostgreSQL creates massive write overhead, slows down customer transactions, and increases hosting costs.
What are the most important resource cost metrics to track for AI digital employees?
You should track input and output token counts per agent run, API costs per completed task, model caching efficiency, average execution latency per tool call, and the ratio of successful task completions to API spend.
How do you capture agentic productivity metrics without slowing down the live agent?
Instead of making the AI agent wait for a database write after every action, the agent publishes structured execution events to an asynchronous, non-blocking message broker or memory cache. The agent immediately moves to its next step while a background service processes the metrics.
Do we need a dedicated third-party monitoring tool to track these metrics?
No. While third-party tools exist, building a lightweight, custom monitoring pipeline gives you 100% control over your operational data, allows you to display custom business metrics directly in your administrative portal, and ensures you retain full ownership of your telemetry data.
Read next
Beyond Chatbots: How to Build AI Agents That Actually Do Work for Your Business
Most businesses use AI to answer questions. Here is how to build custom AI agents that actually take action, connect to your internal tools, and handle complex workflows.
Beyond the Wrapper: How to Build Custom AI Agents for Business That Actually Work
Many businesses invest in basic AI wrappers only to find they lack the security and context needed for real work. Here is how to build custom AI agents that integrate deeply with your workflows and databases.
Enterprise AI Maintenance Costs: Budgeting for Year Two and Beyond
Building an AI system is only half the battle. Discover the practical, ongoing operational costs of enterprise AI, including token management, model drift, and continuous security audits.
Oracon Global builds production-grade AI agents, automation and apps — and you own the code and IP. Tell us what you want to automate.
Book a call →See our work